Characteristics of Unmarried Partners and Married Spouses, 2000
Updated August 5, 2020 |
Infoplease Staff


(in thousands)
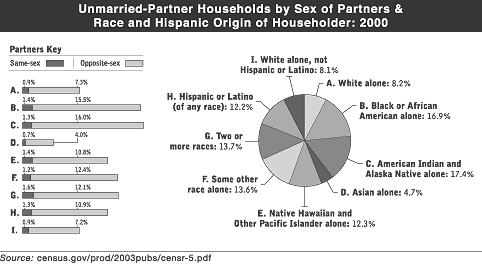
The following table shows the number and percent of unmarried partners and married spouses in the United States according to sex, age, race, education, labor force status, personal earnings, and presence of children.
| Number | Percent | |||||||
|---|---|---|---|---|---|---|---|---|
| Unmarried partners | Married spouses | Unmarried partners | Married spouses | |||||
| Characteristic | Men | Women | Men | Women | Men | Women | Men | Women |
| Total | 3,822 | 3,822 | 56,497 | 56,497 | 100.0% | 100.0% | 100.0% | 100.0% |
| Age: | ||||||||
| 15 to 24 years old | 597 | 937 | 1,321 | 2,386 | 15.6 | 24.5 | 2.3 | 4.2 |
| 25 to 34 years old | 1,413 | 1,269 | 9,296 | 10,964 | 37.0 | 33.2 | 16.5 | 19.4 |
| 35 years old and over | 1,811 | 1,616 | 45,881 | 43,146 | 47.4 | 42.3 | 81.2 | 76.4 |
| Race and Hispanic origin | ||||||||
| White | 3,127 | 3,147 | 49,668 | 49,581 | 81.8 | 82.3 | 87.9 | 87.8 |
| Non-Hispanic | 2,710 | 2,742 | 44,350 | 44,142 | 70.9 | 71.7 | 78.5 | 78.1 |
| Black | 562 | 498 | 4,294 | 4,097 | 14.7 | 13.0 | 7.6 | 7.3 |
| Asian and Pacific Islander | 63 | 105 | 2,118 | 2,393 | 1.6 | 2.7 | 3.7 | 4.2 |
| Hispanic (of any race) | 453 | 433 | 5,550 | 5,671 | 11.9 | 11.3 | 9.8 | 10.0 |
| Education | ||||||||
| Less than high school | 683 | 599 | 8,314 | 7,160 | 17.9 | 15.7 | 14.7 | 12.7 |
| High school graduate | 1,441 | 1,357 | 17,506 | 19,950 | 37.7 | 35.5 | 31.0 | 35.3 |
| Some college | 996 | 1,223 | 14,002 | 14,968 | 26.1 | 32.0 | 24.8 | 26.5 |
| College graduate | 702 | 643 | 16,674 | 14,419 | 18.4 | 16.8 | 29.5 | 25.5 |
| Labor force status Employed | 3,179 | 2,894 | 42,854 | 34,067 | 83.2 | 75.7 | 75.9 | 60.3 |
| Unemployed | 187 | 178 | 992 | 961 | 4.9 | 4.7 | 1.8 | 1.7 |
| Not in labor force | 453 | 747 | 12,650 | 21,468 | 11.9 | 19.5 | 22.4 | 38.0 |
| Personal earnings | ||||||||
| Without earnings | 402 | 642 | 11,353 | 19,368 | 10.5 | 16.8 | 20.1 | 34.3 |
| With earnings | 3,419 | 3,178 | 45,144 | 37,132 | 89.5 | 83.2 | 79.9 | 65.7 |
| Under $5,000 | 184 | 373 | 1,874 | 4,683 | 4.8 | 9.8 | 3.3 | 8.3 |
| $5,000 to $9,999 | 286 | 395 | 1,665 | 4,183 | 7.5 | 10.3 | 2.9 | 7.4 |
| $10,000 to $14,999 | 360 | 445 | 2,401 | 4,497 | 9.4 | 11.6 | 4.2 | 8.0 |
| $15,000 to $19,999 | 410 | 441 | 3,101 | 4,427 | 10.7 | 11.5 | 5.5 | 7.8 |
| $20,000 to $24,999 | 401 | 397 | 3,561 | 4,249 | 10.5 | 10.4 | 6.3 | 7.5 |
| $25,000 to $29,999 | 336 | 315 | 3,595 | 3,429 | 8.8 | 8.2 | 6.4 | 6.1 |
| $30,000 to $39,999 | 548 | 405 | 7,492 | 4,954 | 14.3 | 10.6 | 13.3 | 8.8 |
| $40,000 to $49,999 | 337 | 201 | 6,096 | 2,976 | 8.8 | 5.3 | 10.8 | 5.3 |
| $50,000 to $74,999 | 370 | 137 | 8,703 | 2,683 | 9.7 | 3.6 | 15.4 | 4.7 |
| $75,000 and over | 187 | 69 | 6,656 | 1,051 | 4.9 | 1.8 | 11.8 | 1.9 |
| Presence of children | ||||||||
| With children1 | 1,563 | 1,563 | 25,771 | 25,771 | 40.9 | 40.9 | 45.6 | 45.6 |
NOTE: Data are not shown separately for the American Indian and Alaska Native population because of the small sample size in the Current Population Survey in March 2000.
1. May be own children of either partner or both partners. Excludes ever married children under 18 years.
Source: U.S. Census Bureau, Current Population Survey, March 2000.
 |
| Marital Status of the Population by Sex, 1900–2004 | Marital Status | Singles in the United States |


