Union Membership, by States

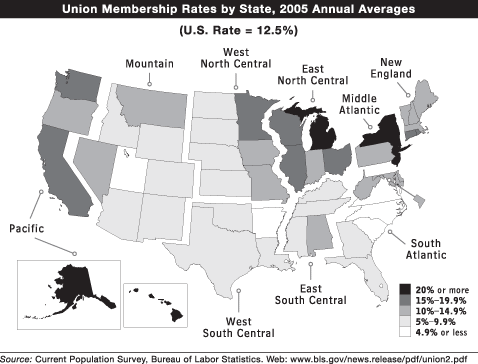
In 2005, 12.5% of wage and salary workers were union members, unchanged from 2004. The number of persons belonging to a union rose slightly over the year to nearly 15.7 million in 2005. The union membership rate has declined from a high of 20.1% in 1983, the first year for which comparable union data are available. Union membership among wage and salary workers shows a distinct geographic pattern, according to the Current Population Survey. Union membership is highest in the Northeast, Midwest, and Pacific regions, and lowest in the South.
Five states had union membership rates over 20% in 2005: New York (26.1%), Hawaii (25.8%), Alaska (22.8%), and Michigan and New Jersey (20.5% each). These states have been among the most unionized since at least 1995. North Carolina and South Carolina continued to report the lowest union membership rates, 2.9% and 2.3%, respectively.
The largest numbers of union members lived in California (2.4 million) and New York (2.1 million). Just over half (7.9 million) of the 15.7 million union members in the U.S. lived in six states (California, New York, Illinois, Michigan, Ohio, and New Jersey), although these states accounted for slightly less than one-third of wage and salary employment nationally.
 |


